23 Jul 2026
From Field to Screen: How Athlete Stats Drive Rapid Changes in Tennis, Cricket, and Basketball Odds
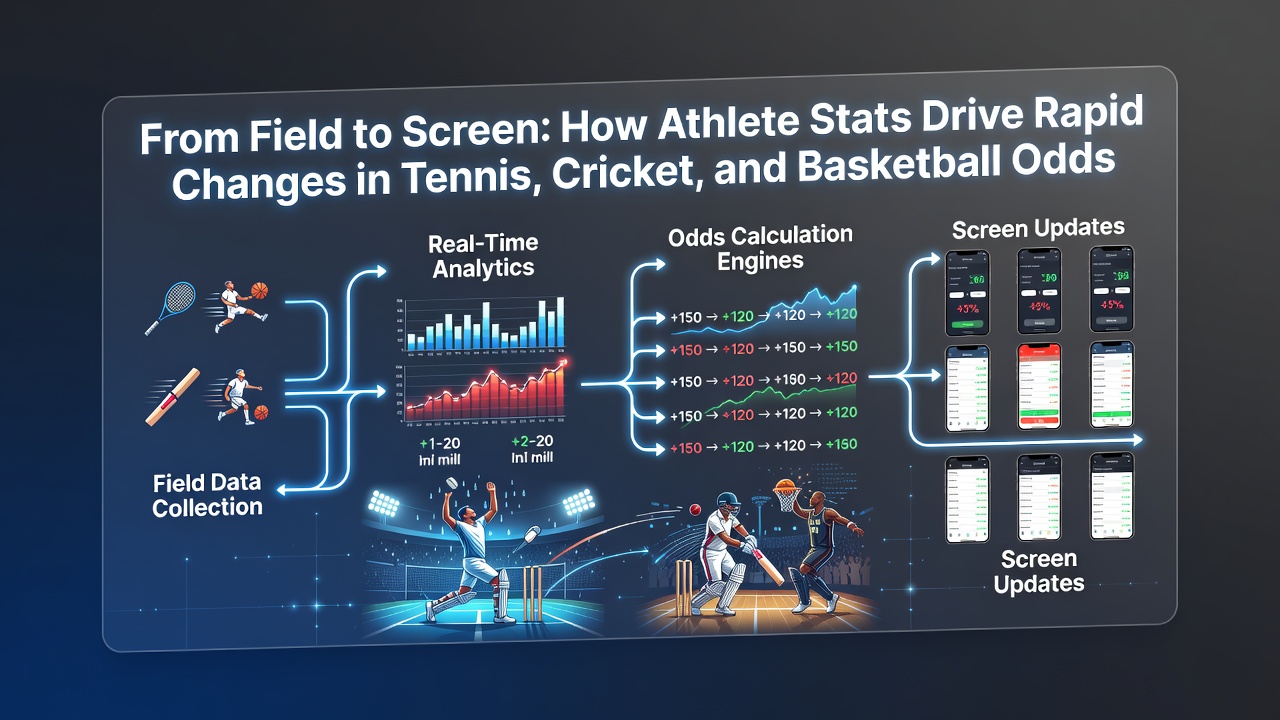
Data from player tracking systems flows directly into betting platforms where algorithms recalculate probabilities within seconds of each point, delivery, or possession, and this integration has become standard across major tournaments by July 2026. Real-time statistics on serve velocity in tennis, bowling economy rates in cricket, and shooting efficiency in basketball trigger immediate shifts in live odds as bookmakers adjust lines to reflect updated win probabilities.
Real-Time Metrics Reshaping Tennis Markets
Tennis matches generate granular data through sensors and cameras that capture every serve, rally length, and error type, and these figures update odds on sets, games, and individual player props almost instantly. When a player records an elevated first-serve percentage or reduced unforced error count during a set, markets on next-game winners and total games move accordingly because the underlying probability models incorporate the new inputs directly. Observers note that ATP and WTA events rely on official data feeds that transmit to operators within milliseconds, allowing platforms to tighten or widen spreads on live bets without manual intervention.
Cricket Performance Data Influencing Live Lines
Cricket delivers continuous streams of batting strike rates, bowling figures, and partnership contributions that alter odds on match winners, run totals, and player milestones during T20 and ODI fixtures. A bowler who maintains a sub-6 economy rate or a batter who accelerates beyond 150 strike rate sees corresponding adjustments in over/under markets and next-wicket probabilities because the statistical models weight recent deliveries heavily. International Cricket Council protocols ensure standardized data collection across venues, and this consistency enables betting systems to process updates from multiple matches simultaneously while maintaining accuracy in fluctuating conditions.
Basketball Analytics Driving Rapid Odds Adjustments
Basketball produces high-frequency statistics on points per possession, defensive rating, and assist-to-turnover ratios that prompt quick revisions to quarter totals, spread lines, and individual player props throughout NBA and international games. When a team improves its three-point shooting percentage or reduces fouls in a specific period, live betting interfaces reflect those gains through updated probabilities calculated from integrated tracking data. League-wide systems such as those employed by the NBA supply synchronized feeds that operators use to recalibrate odds across thousands of concurrent wagers, and the volume of data points per game exceeds those available in most other sports.
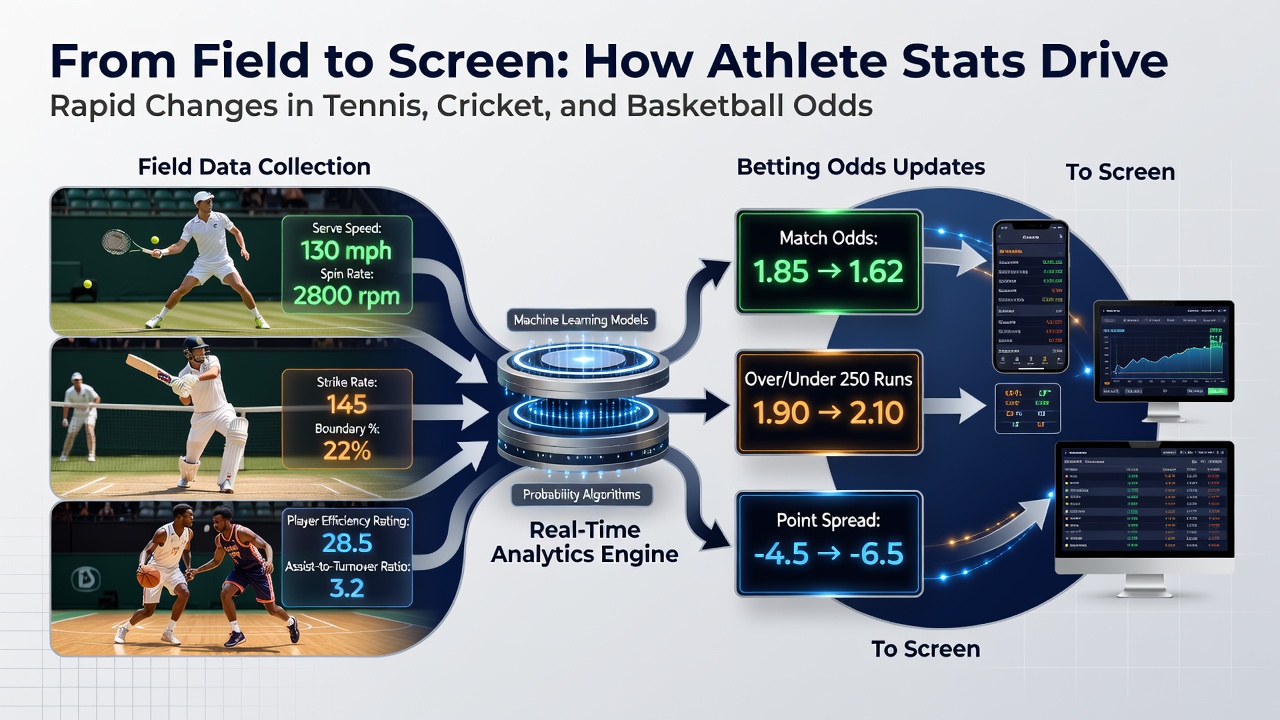
Industry reports highlight how these data pipelines reduce latency between on-field events and market movements, and one study from the Australian Institute of Sport examined the correlation between immediate performance indicators and odds volatility across multiple codes. The research found that matches with denser statistical tracking exhibit more frequent but smaller adjustments rather than large swings after isolated moments. Operators integrate these feeds through APIs that connect directly to central databases, and this architecture supports simultaneous updates for in-play tennis sets, cricket overs, and basketball quarters without requiring separate manual reviews.
Technical Infrastructure Behind the Shifts
Betting platforms employ machine learning models trained on historical datasets that weight current match statistics against baseline expectations, and the outputs generate revised odds that appear on customer interfaces within defined time windows. In July 2026 tournaments, enhanced sensor technology in tennis rackets and cricket stumps has increased the granularity of inputs, while basketball arenas continue to expand optical tracking coverage. These upgrades allow models to account for situational factors such as fatigue indicators derived from movement data, and the resulting probability recalibrations occur at intervals measured in fractions of a second.
Regulatory frameworks in various jurisdictions require operators to maintain transparent audit trails for odds changes linked to official data sources, and this oversight ensures that adjustments remain tied to verifiable performance metrics rather than discretionary decisions. European and North American gaming authorities have published guidelines on the use of automated systems, and compliance documentation often references the same player-tracking standards employed by international sports federations. The result is a closed loop where field events translate into screen updates that reflect measurable athletic output with minimal delay.
Conclusion
Statistical integration across tennis, cricket, and basketball has established a direct pathway from athletic performance to dynamic betting markets, and the infrastructure supporting these connections continues to evolve through improved sensors and refined algorithms. Data from official league sources and independent research confirms that real-time metrics produce measurable, rapid revisions in live odds while maintaining consistency with historical patterns observed across seasons. As tracking technology advances further, the interval between field action and screen updates is expected to shorten even more, sustaining the continuous alignment between player statistics and market probabilities.