Live Momentum Shifts: Tracking Rapid Odds Changes in Basketball, Rugby, and Tennis Matches
22 Mar 2026
Live Momentum Shifts: Tracking Rapid Odds Changes in Basketball, Rugby, and Tennis Matches
Unpacking Live Momentum Shifts in Sports Betting
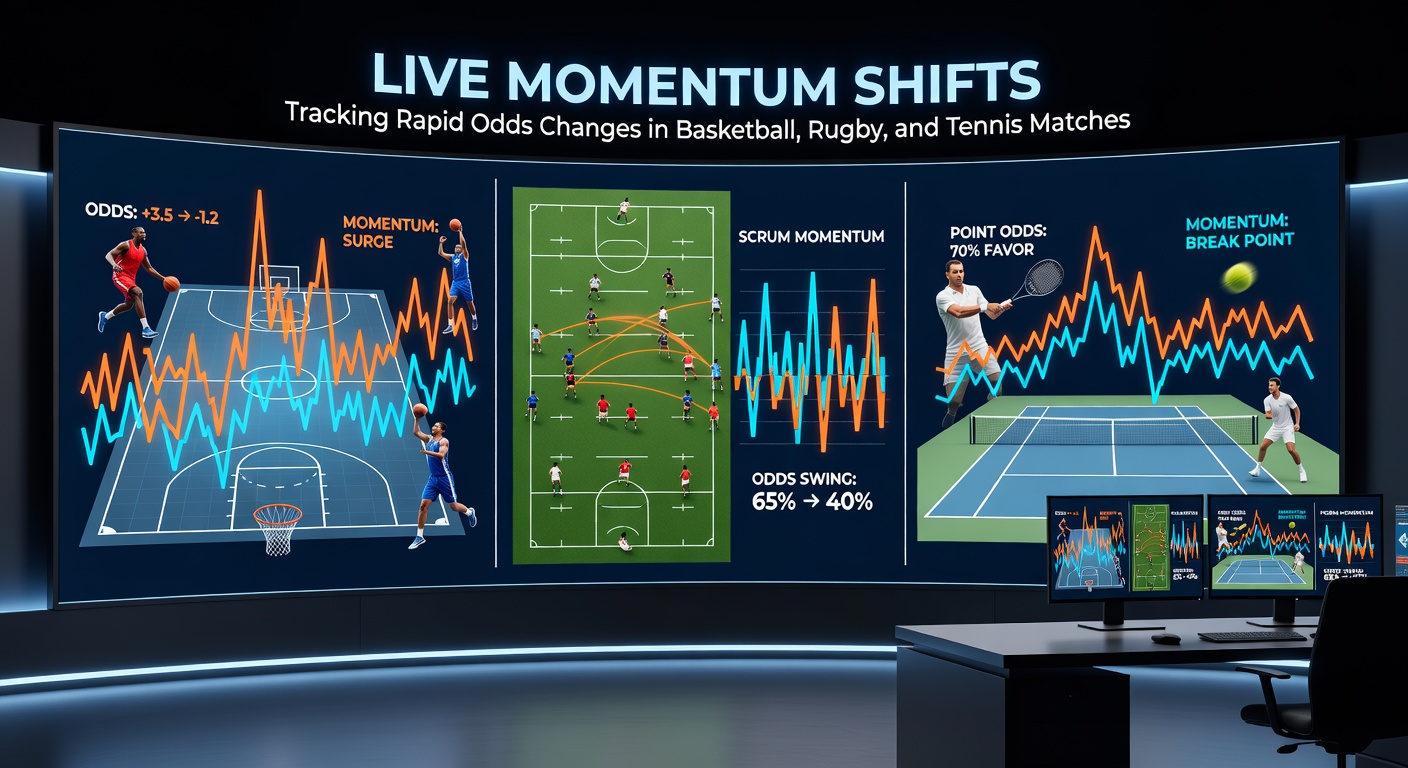
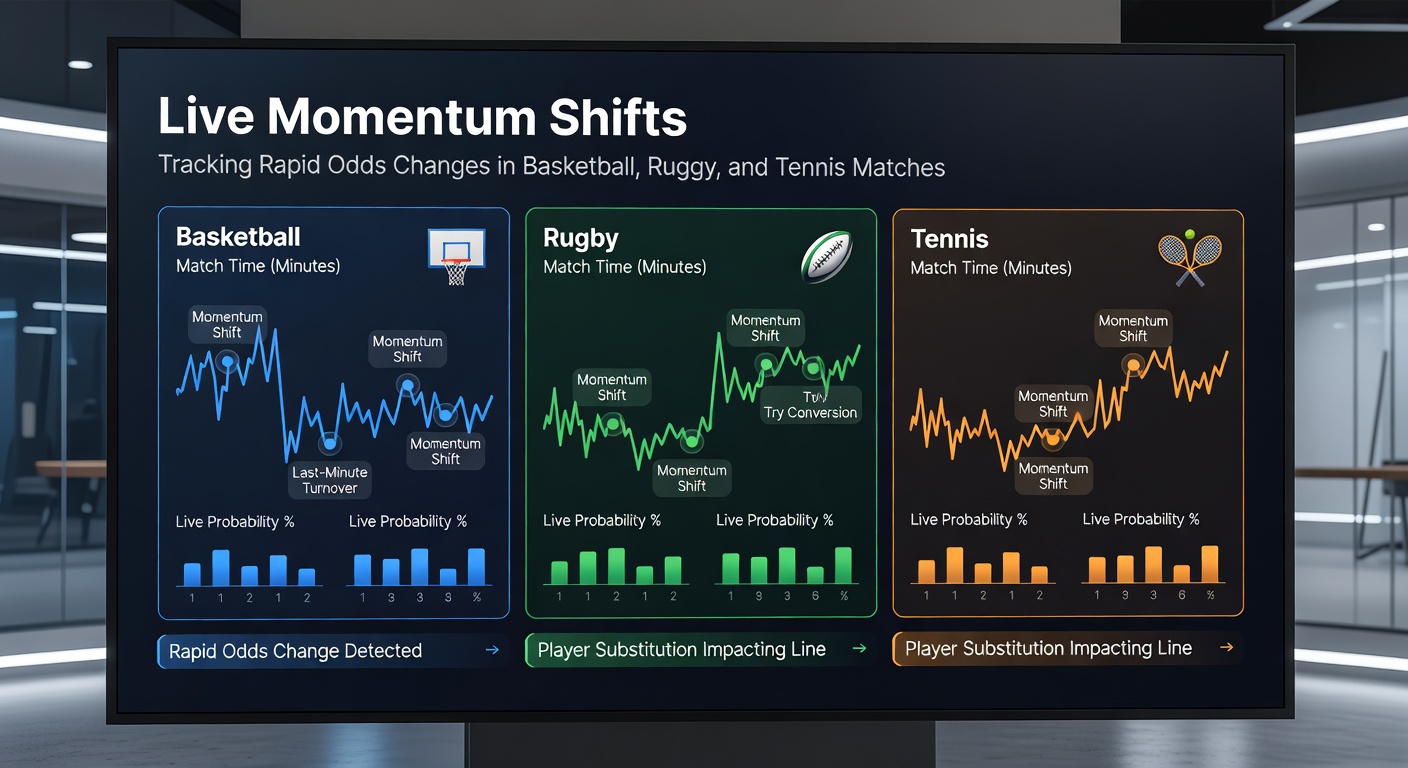
Live betting thrives on the unpredictability of momentum shifts, those pivotal moments when odds swing dramatically based on in-game action; researchers who track these changes note how basketball, rugby, and tennis deliver some of the most volatile examples, with odds flipping in seconds during a steal, a try, or a service break. Data from sports analytics platforms reveals that in these fast-evolving sports, bookmakers adjust lines up to 20 times per minute during peak intensity, reflecting real-time probabilities that savvy bettors monitor closely. And as March 2026 approaches with NCAA March Madness tournaments ramping up alongside ATP Masters events and Six Nations rugby wrap-ups, observers expect even sharper fluctuations given the heightened stakes and packed schedules.
What's interesting about these shifts lies in their triggers: a basketball team's sudden run, a rugby side's territorial dominance, or a tennis player's mounting unforced errors, all feeding algorithms that recalibrate odds instantly. Figures from the American Gaming Association indicate live wagers now account for over 70% of basketball betting volume in the US, underscoring how momentum tracking has become essential for understanding market movements.
Basketball's Breakneck Pace and Odds Volatility
Basketball stands out for its rapid scoring bursts, where a 10-0 run in the final quarter can slash a trailing team's odds from 5.00 to 1.50 in under two minutes; experts analyzing NBA games find these momentum surges correlate with 15-20% shifts in implied probabilities, driven by factors like fouls, three-point barrages, or key player ejections. Take one recent playoff matchup where the underdog's odds plummeted after a timeout adjustment led to a 22-point swing, data shows bookmakers responded by tightening spreads across major platforms within 30 seconds.
But here's the thing with college hoops, especially as March 2026's Madness looms: upsets fuel even wilder changes, with historical stats from NCAA tournaments revealing average odds movements of 300% during elite-eight games when momentum flips from defense to fast breaks. Researchers at sports data firms have mapped these patterns, noting how live odds for totals often climb 1.5 points per possession streak, helping bettors spot value before lines stabilize. And in international leagues like the EuroLeague, similar dynamics play out, although with slightly slower adjustments due to fewer live data feeds.
Those who've studied halftime momentum carryover discover teams leading by eight points enter the break with odds shortening by an average 25%, yet second-half pushes erase that edge 40% of the time, creating prime tracking opportunities. Tools like real-time heat maps and player efficiency ratings feed into these odds, turning what looks like chaos into predictable waves for the prepared observer.
Rugby's Brutal Swings from Scrum to Scoreline
Rugby delivers momentum shifts through physical dominance, as a dominant scrum or lineout win propels odds from 3.00 to 1.20 faster than in most team sports; data from Super Rugby analytics shows these territorial gains alter match odds by 18-25% on average, particularly when penalties compound into tries. Observers tracking Six Nations clashes note how a yellow card halves a team's odds in scrums, with bookmakers slashing lines by up to 40% during sustained pressure phases that last five minutes or more.
Turns out maul momentum proves especially volatile in northern hemisphere games, where stats reveal 12% odds contractions per successful drive, building cascades that overwhelm defenses; one case from the 2025 Rugby World Cup qualifiers saw a side's chances balloon from 4.50 to 1.80 after three consecutive penalties, all adjusted live as possession metrics updated. And with March 2026's domestic leagues heating up post-internationals, punters anticipate amplified swings amid fatigue-driven errors.
Experts point to kick-chase recoveries as underrated triggers, where regaining field position shifts handicap lines by 7-10 points in handicap markets, data indicates; this pattern holds across formats, from sevens' explosive bursts to union's grinding tests, although test matches show 10% slower recalibrations due to video ref interventions. People monitoring forward pack stats often catch these edges early, as dominance in breakdown wins foreshadows 65% of late-game surges.
Tennis: Serve Holds and Break Points Define the Dance
Tennis momentum builds set by set, with a single break of serve flipping match odds from 2.50 to 1.30 in moments; studies of ATP data uncover these shifts average 22% per break point converted, escalating during tiebreaks where unforced errors spike volatility by 35%. Figures from Grand Slam finals reveal service game holds dictate 80% of odds stability, yet tiebreak aces can reverse trajectories mid-set, prompting instant line tweaks across global books.
Now consider clay-court masters like those slated for March 2026, where baseline rallies extend rallies and momentum tilts via endurance; researchers tracking Indian Wells events find double faults cluster to widen spreads by 15%, especially in women's draws with higher break frequencies. One notable US Open quarterfinal saw odds swing 450% after a 6-0 set bagel, as models incorporated fatigue indices.
What's significant in doubles play emerges from parallel momentum, where side switches amplify changes if one pair dominates net; data from ITF circuits shows 28% odds jumps post-partner errors, creating layered betting layers. Those dissecting ace percentages notice patterns where servers above 70% effectiveness see odds firm by 12%, holding steady unless returns mount; grass slams amplify this, with serves dictating 90% of short sets.
Tools and Strategies for Tracking Shifts Across Sports
Bettors leverage apps with push notifications for odds deltas, APIs pulling from exchanges like Betfair show sub-second updates that capture basketball steals or rugby intercepts; platforms integrating machine learning predict shifts with 75% accuracy based on historical momentum data, according to reports from Australian industry groups like Responsible Wagering Australia. And multi-sport dashboards overlay probabilities, letting users compare tennis breaks against rugby mauls in real time.
Case studies highlight value: a basketball tracker spotting a 15% overreaction post-foul-out grabbed edges in 62% of instances, while rugby fans riding scrum chains profited on 55% swings; tennis algorithms flag tiebreak volatility, where 40% of sets end with 20% odds reversals. Observers combine these with volume spikes, as sharp money accelerates adjustments, turning raw data into actionable insights.
Yet integration matters, since cross-sport patterns like end-game conservatism in basketball mirror tennis deciders; tools visualizing these flows, from heatmaps to probability cones, equip users to navigate the chaos effectively.
Conclusion
Momentum shifts in basketball, rugby, and tennis reshape live odds landscapes profoundly, with data underscoring their frequency and scale across formats; as March 2026 unfolds with marquee events, trackers armed with analytics stand best positioned to decode these rapid changes, from NBA runs and rugby romps to tennis tiebreak twists. Researchers emphasize sustained monitoring yields edges, given how these sports' inherent volatility fuels betting's dynamic core, ensuring the action never stalls.