4 Jun 2026
Tech Systems Quietly Refining Outcome Models in Golf, Horse Racing, and Esports

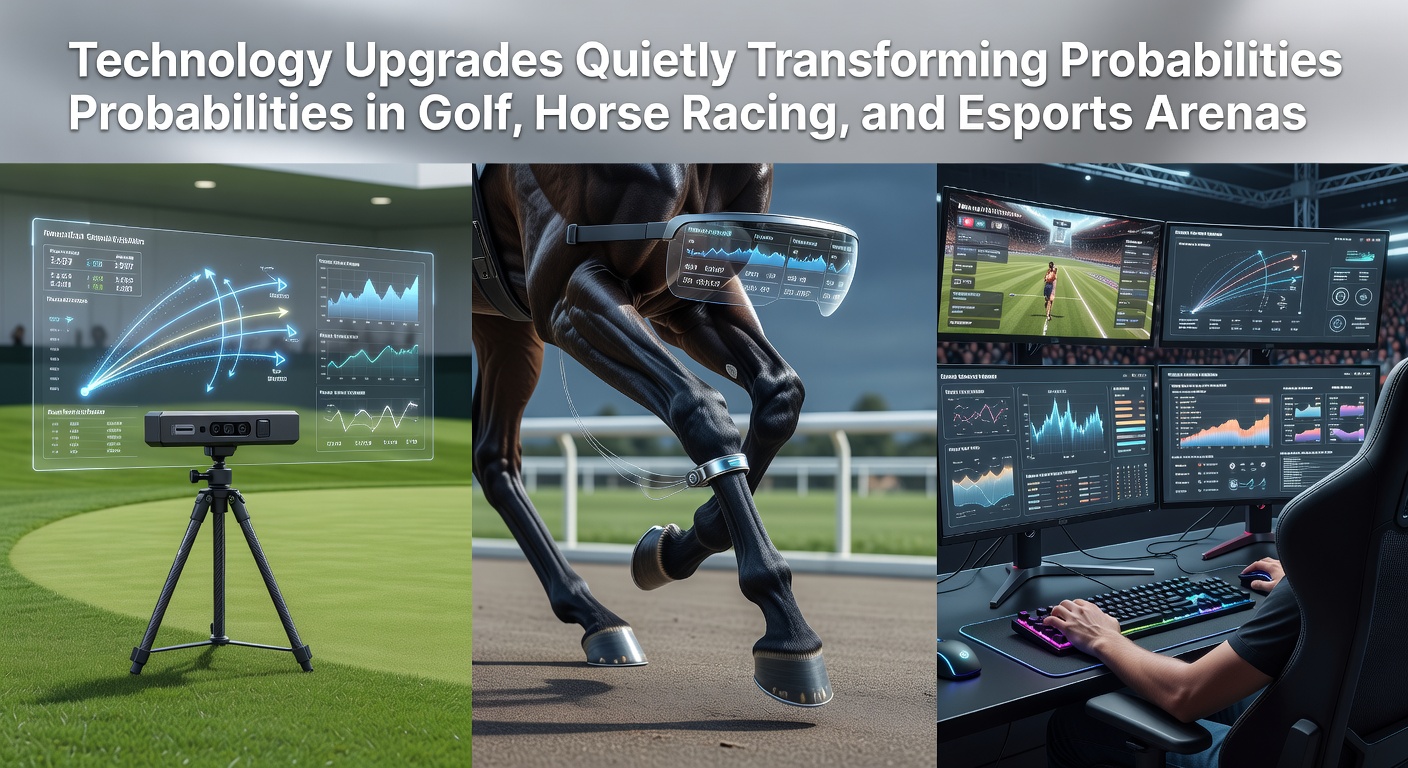
Technology upgrades have started reshaping how probabilities get calculated across golf courses, racetracks, and competitive gaming platforms, with new tools feeding real-time data into models that adjust odds more precisely than earlier manual methods allowed. Observers note that these changes trace back to sensor networks, machine learning algorithms, and integrated databases that capture variables previously left to estimation, and the effects show up in June 2026 through tighter spreads on major tournaments and events.
Precision Tools on the Fairways
Golf analytics now rely on launch monitors and wearable devices that record club speed, ball spin, and launch angles during every shot, while course mapping software accounts for wind patterns and green contours with meter-level accuracy. Researchers at institutions studying sports performance have documented how these inputs feed into probability engines that recalculate player win chances after each hole, and data from the 2025 PGA season onward demonstrates reduced variance in projected outcomes when compared with historical averages. Players and oddsmakers both use the same underlying datasets, which creates convergence around expected results rather than broad ranges that once dominated pre-round betting lines.
Course management systems also incorporate soil moisture readings and turf health metrics collected daily, so models adjust for how rain affects roll distances on specific holes. Those who've analyzed multiple seasons point out that such granular adjustments appear most clearly in match-play formats where cumulative probability shifts matter more than single-round totals.
Biometric and Track Data in Horse Racing
Horse racing operations have integrated GPS trackers and heart-rate monitors into saddles and bridles, producing continuous streams that reveal fatigue thresholds and stride efficiency during workouts and races. Track surface sensors meanwhile log hardness, moisture content, and temperature at multiple points around each circuit, allowing probability models to update split-second assessments of how conditions favor certain running styles. Industry reports from bodies such as the Australian Racing Board highlight how these inputs correlate with finishing times across thousands of starts, and the resulting adjustments narrow the gap between morning-line odds and final pools more consistently than older weather-only forecasts achieved.
Trainers and analysts review post-race biometric logs to refine future entries, which in turn influences market pricing for upcoming cards. In June 2026 several major meets have shown smaller discrepancies between public money and computer-generated probabilities once these data layers became standard across participating stables.
Player Tracking in Esports Environments
Esports platforms embed telemetry that captures reaction times, mouse movements, in-game resource management, and positioning coordinates for every participant, while server logs record latency and frame-rate stability that affect execution. Probability frameworks now ingest these streams alongside historical match data, producing live updates that shift rapidly when a team's average accuracy metric deviates from its season baseline. Studies published through academic channels such as those hosted by the Massachusetts Institute of Technology have examined how these variables influence series outcomes, and figures reveal tighter clustering around predicted win rates once latency compensation and aim-consistency scores enter the equations.
Event organizers in major leagues have begun publishing anonymized aggregate telemetry after matches, which lets external models incorporate the same signals used by professional betting desks. The result appears in reduced volatility for map-specific wagers, since known performance envelopes replace broader uncertainty bands that previously widened spreads.
Cross-Sector Data Integration Patterns
Common threads run through all three domains because each now depends on standardized data pipelines that merge on-site sensors with cloud-based computation. Golf swing data, equine stride analytics, and esports kill-death ratios all flow into comparable machine-learning architectures that retrain nightly on fresh results, and this shared methodology produces probability outputs that update at similar frequencies across otherwise unrelated competitions. Regulatory filings from North American gaming authorities indicate rising adoption rates for these systems among licensed operators, while European trade associations report parallel investments by venue operators seeking consistent pricing accuracy.
What's interesting is how the same underlying improvements in sensor calibration and algorithmic transparency affect markets differently depending on event duration, with shorter esports matches showing faster convergence than multi-day golf tournaments or multi-leg racing cards. Yet the directional effect remains consistent: narrower bands between opening and closing lines once verified data replaces subjective assessments.
Conclusion
Technology upgrades continue to embed deeper into probability calculations for golf, horse racing, and esports, with sensor networks and algorithmic processing delivering measurable refinements to outcome forecasts. Observers tracking June 2026 events record the cumulative impact through tighter market spreads and reduced variance between modeled expectations and actual results across these arenas. The pattern points toward sustained reliance on integrated data streams rather than isolated variables, as each sector incorporates the same core upgrades at comparable rates.